Polar Coordinates

Rectangular coordinates allow us to describe a point $ (x,y)$ in the plane in a different way, namely

$\displaystyle (x,y) \leftrightarrow (r, \theta),
$

where $ r$ is any real number and $ \theta$ is an angle.

Polar coordinates are extremely useful, especially when thinking about complex numbers. Note, however, that the $ (r,\theta)$ representation of a point is very non-unique.

First, $ \theta$ is not determined by the point. You could add $ 2\pi$ to it and get the same point:
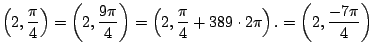
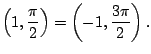
$\displaystyle \left(2,\frac{\pi}{4}\right)= \left(2,\frac{9\pi}{4}\right)
= \left(2,\frac{\pi}{4}+389\cdot 2\pi\right).
= \left(2,\frac{-7\pi}{4}\right)
$

Also that $ r$ can be negative introduces further non-uniqueness:

$\displaystyle \left(1, \frac{\pi}{2}\right) = \left(-1, \frac{3\pi}{2}\right).
$

Think about this as follows: facing in the direction $ 3\pi/2$ and backing up 1 meter gets you to the same point as looking in the direction $ \pi/2$ and walking forward 1 meter.

We can convert back and forth between cartesian and polar coordinates using that

$\displaystyle x$ $\displaystyle =r\cos(\theta)$ (4.1)
$\displaystyle y$ $\displaystyle =r\sin(\theta),$ (4.2)

and in the other direction

$\displaystyle r^2$ $\displaystyle =x^2 + y^2$ (4.3)
$\displaystyle \tan(\theta)$ $\displaystyle =\frac{y}{x}$ (4.4)

(Thus $ r = \pm \sqrt{x^2+y^2}$ and $ \theta = \tan^{-1}(y/x).$)

Example 4.1.1   Sketch $ r=\sin(\theta)$, which is a circle sitting on top the $ x$ axis.
Figure: Graph of $ r=\sin(\theta)$.
% latex2html id marker 12765
\includegraphics[width=0.6\textwidth]{graphs/example_polar1}

We plug in points for one period of the function we are graphing--in this case $ [0,2\pi]$:

0 $ \sin(0) = 0$
$ \pi/6$ $ \sin(\pi/6) = 1/2$
$ \pi/4$ $ \sin(\pi/4) =\frac{\sqrt{2}}{2}$
$ \pi/2$ $ \sin(\pi/2) = 1$
$ 3\pi/4$ $ \sin(3\pi/4) = \frac{\sqrt{2}}{2}$
$ \pi$ $ \sin(\pi) = 0$
$ \pi + \pi/6$ $ \sin(\pi+\pi/6) = -1/2$
<>
Notice it is nice to allow $ r$ to be negative, so we don't have to restrict the input. BUT it is really painful to draw this graph by hand.

To more accurately draw the graph, let's try converting the equation to one involving polar coordinates. This is easier if we multiply both sides by $ r$:

$\displaystyle r^2 = r\sin(\theta).
$

Note that the new equation has the extra solution $ (r=0,\theta=$anything$ )$, so we have to be careful not to include this point. Now convert to cartesian coordinates using (4.1.1) to obtain (4.1.3):

$\displaystyle x^2 + y^2 = y.
$ (4.5)

The graph of (4.1.5) is the same as that of $ r=\sin(\theta)$. To confirm this we complete the square:

$\displaystyle x^2 + y^2$ $\displaystyle = y$    
$\displaystyle x^2 + y^2 - y$ $\displaystyle = 0$    
$\displaystyle x^2 + (y-1/2)^2$ $\displaystyle = 1/4$    

Thus the graph of (4.1.5) is a circle of radius $ 1/2$ centered at $ (0,1/2)$.

Actually any polar graph of the form $ r=a\sin(\theta) +
b\cos(\theta)$ is a circle, as you will see in homework problem 67 by generalizing what we just did.

William Stein 2006-03-15